Architecture Kata “Canteen Traffic Report”
 Develop a software system with which employees can get information about the traffic in their company’s canteen.
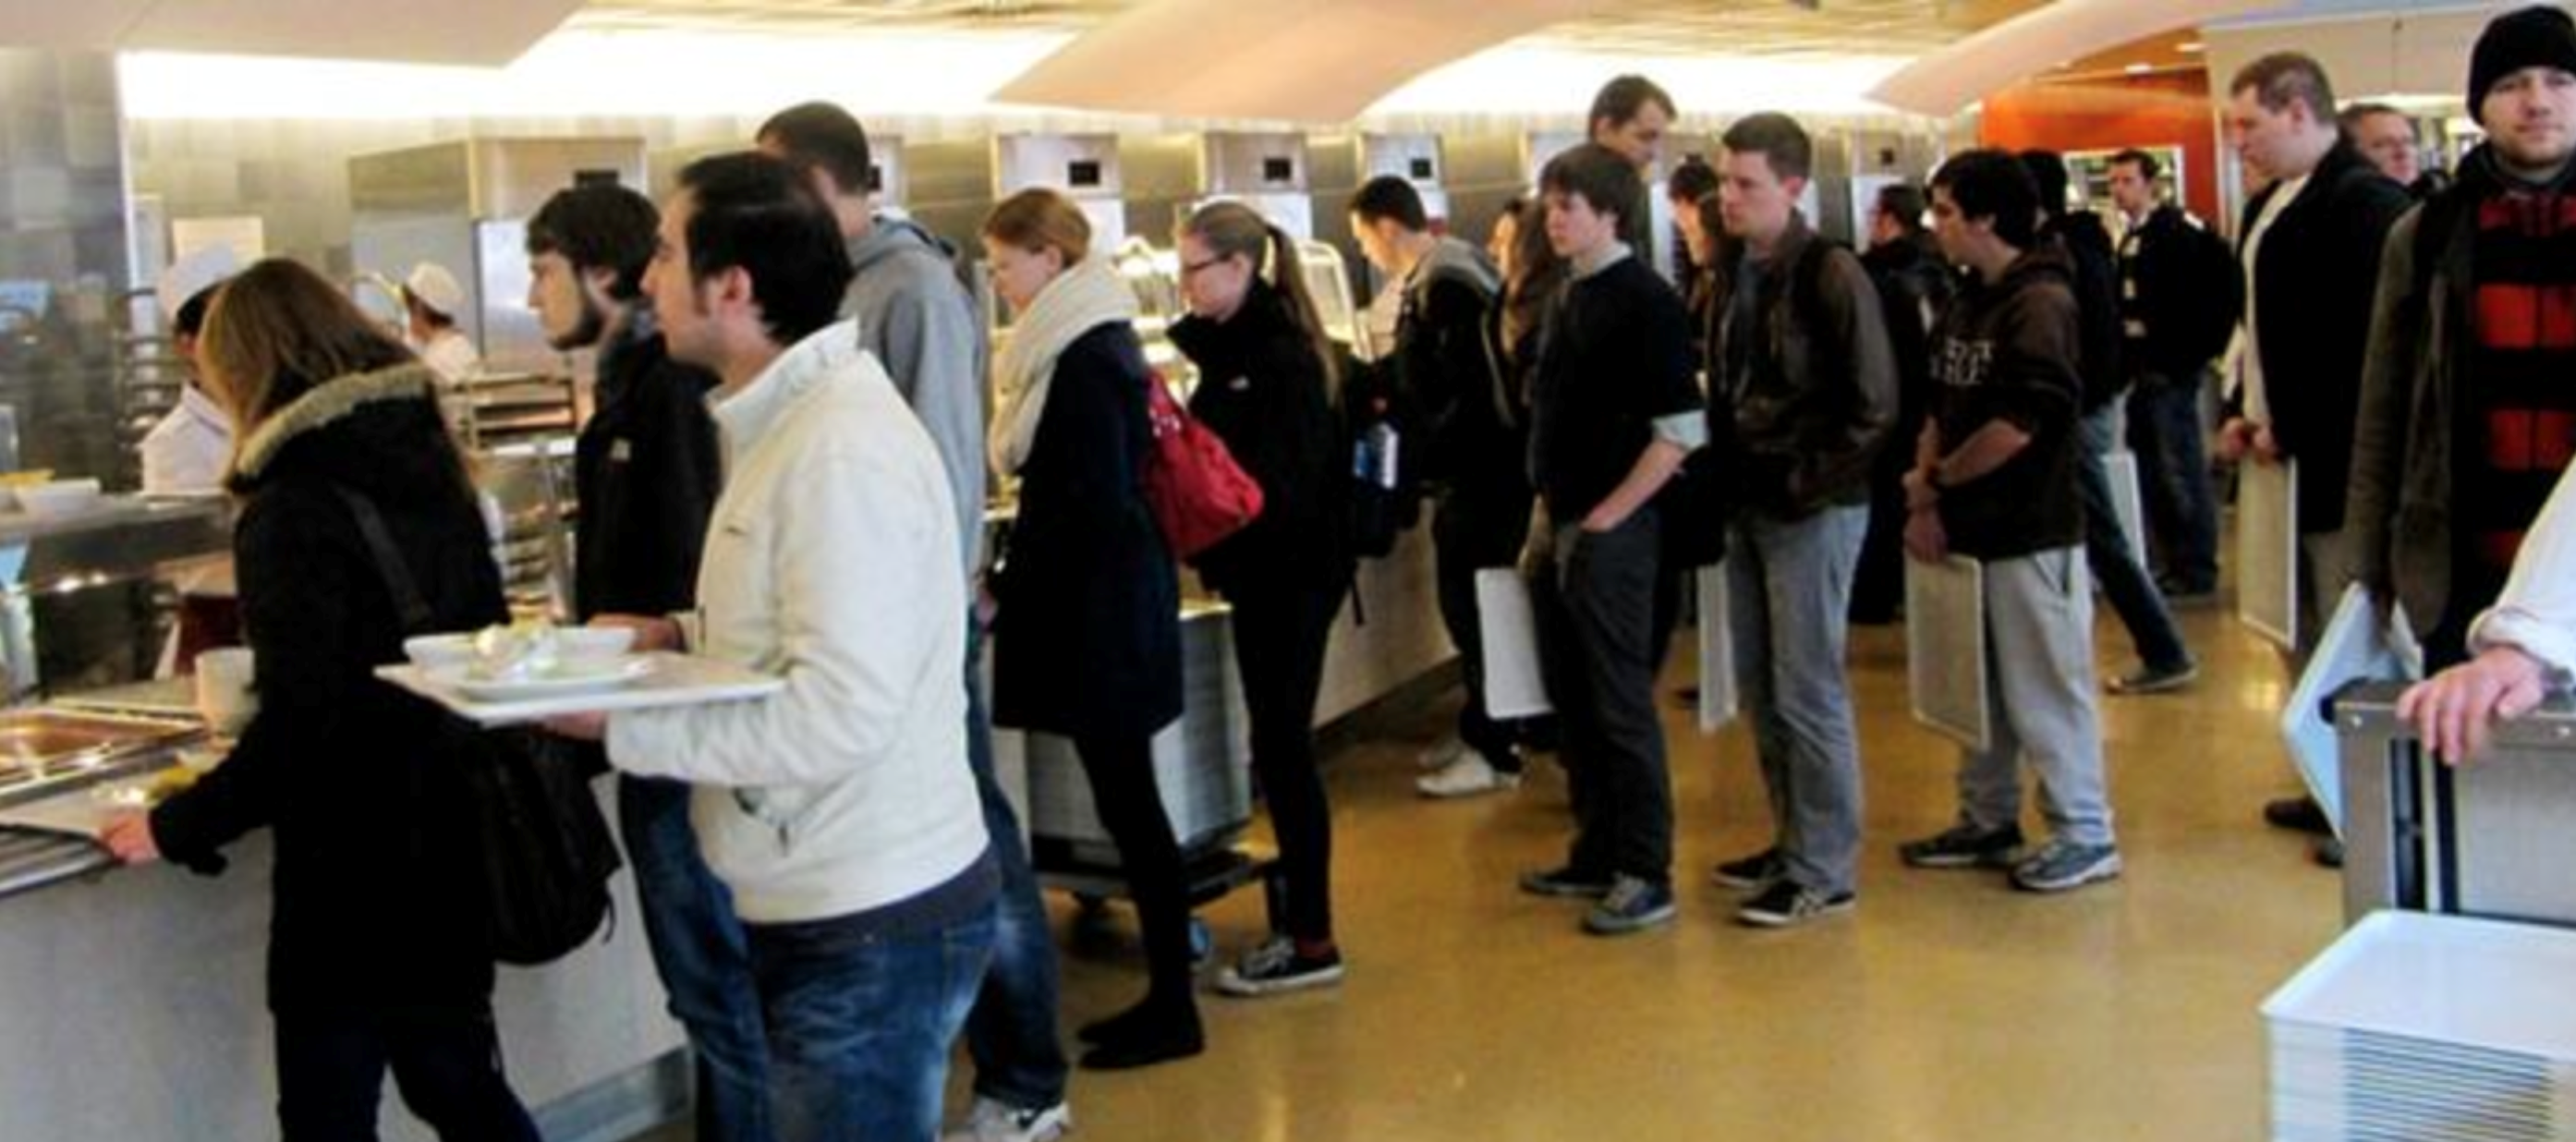
Where hundreds of people share a canteen for lunch each day the question is: “When should I go for lunch?” There might be patterns like “Before noon it’s empty” but this might not hold every day due to vacations, trainings, visitors. It would be useful to quickly get an impression of how “canteen traffic” is developing each day.
It could be displayed how throughput at the cash register changes over time. The x-axis on the diagram would represent time. The y-axis would show e.g. how many people paid their lunch within the past minute. There could also be red/green/yellow bands in the diagram to signify throughput considered low (with long queues) or high.
Instead (or in addition) of measuring the throughput at the cash registers employees could notify the system when they leave their workplace and start heading for the canteen (including the size of the group). This would add some predictive value to the display.
Users could be notified if the throughput falls below a customizable threshold.